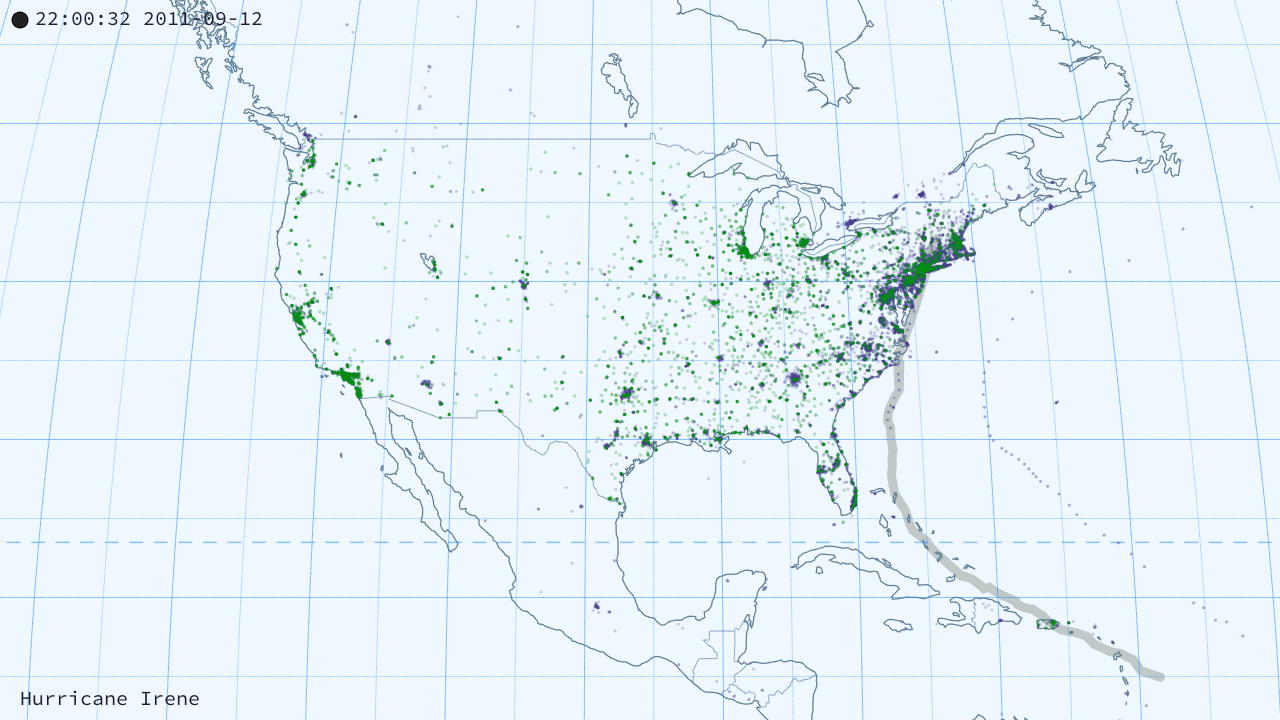
TwiGVis (Twitter Geography Visualizer) is a program I created to visualize all of the tweets my research group had collected during Hurricanes Sandy and Irene. It will give you both still images, like below, and video output.
Later I modified it to also display data from the Red Cross on their mobile donations campaign.
TwiGVis was built using the Processing programming language, which is both free and (in my opinion) relatively pain-free to get started with.
Though I initially created it only for internal use in my lab, we received such good feedback at some talks that I've posted the code online. You can download the code and sample data here. Use and modify it as you wish, according to a GPL license. Read more about the project and see more examples here. I hope some of you find this useful.
Happy mapping!